Code Review Assistant is not restricted to the built-in static analyzers anymore, but instead is able to run any external program to analyze your pull requests.
JetBrains InspectCodeIn the following paragraphs, we show you examples of static analyzers and how they can be integrated into your code reviews with our app:
.
If you experience any issues with including an external static analyzer, please see the troubleshooting instructions.
| Info |
|---|
When you use a custom analyzer, you can either call it with every file of your pull request diff individually by using the placeholder "%f" in the program arguments, or you can use "%fs" which expands to a space-separated list of file paths for all files in your pull request diff. The latter has the advantage that you only need to call your external analyzer once for a pull request, which is much more resource-friendly compared to "%f". If your analyzer (e.g., Checktsyle) supports this, we recommend using "%fs". |
| Anchor | ||||
|---|---|---|---|---|
|
Troubleshooting
When you don't see pull request comments for issues found by your custom analyzer but are sure that they exist, it is likely that the regular expression you defined didn't match the output of the static analyzer.
But there are also other possible reasons why it didn't work like that the user running Bitbucket Server is not allowed to execute the configured static analyzer executable.
To troubleshoot this, we recommend that you enable debug logging for the app as described in How to create debug logging output in Bitbucket. You should then see log messages like
2016-08-11 09:01:31,953 DEBUG [io-pump:thread-53] c.m.s.c.a.c.CustomAnalyzerOutputHandler CRA4STASH:
Experienced output line for OCLint not matching configured regular expression \d+:(?<message>.*):
src/shapes/Circle.cpp:6:16: short variable name [naming|P3] Variable name with 1 characters is shorter than the threshold of 3
As you can see from this debug log message, the output didn't match the configured regular expression because in this example, we forgot the regular expression for the file path.
With the debug log messages, you should be able to find the cause of why no pull request annotations are created for found code violations.
After you resolved all issues, please do not forget to reset debug logging for the app as described in How to create debug logging output in Bitbucket.
| Anchor | ||||
|---|---|---|---|---|
|
Example configurations
| Anchor | ||||
|---|---|---|---|---|
|
Checkstyle
Checkstyle is a static analyzer tool to help programmers write Java code that adheres to a certain coding standard.
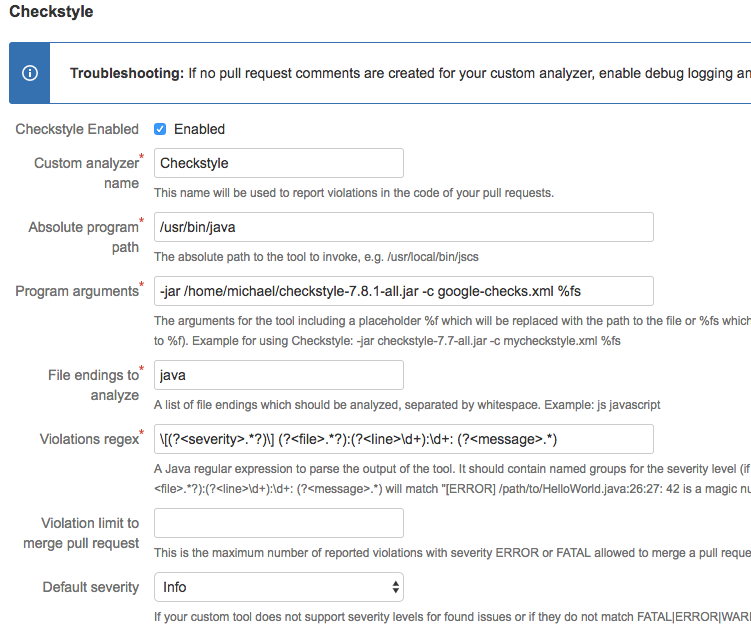
Program arguments:
-jar checkstyle-7.7-all.jar -c mycheckstyle.xml %fs
Violations regex:
\[(?<severity>.*?)\] (?<file>.*?):(?<line>\d+):(?:\d+:)? (?<message>.*)
| Anchor | ||||
|---|---|---|---|---|
|
PMD
PMD is an extensible cross-language static code analyzer.
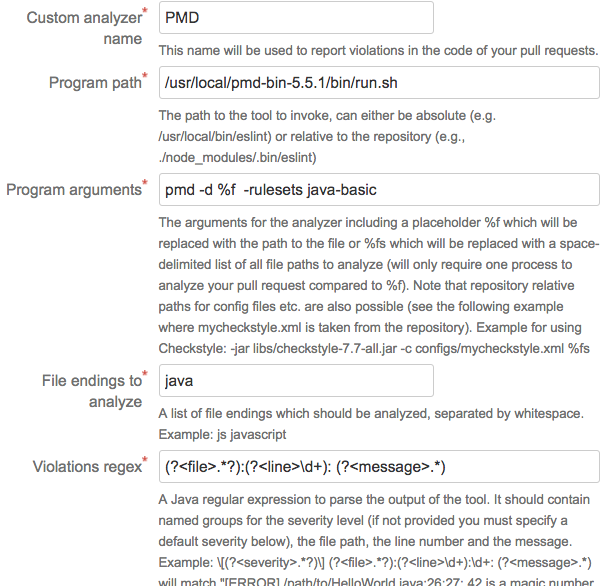
Program arguments:
pmd -d . -R rulesets/java/quickstart.xml -failOnViolation false Violations regex:
(?<file>.*?):(?<line>\d+):\s+(?<message>.*)
| Anchor | ||||
|---|---|---|---|---|
|
OCLint
OCLint is an open source tool for detecting bugs in C, C++ and Objective-C code. To analyze a source file with OCLint, one calls it like follows:
oclint <src_file_path> -- c <compiler-options>
To configure Code Review Assistant to use OCLint, go to the repository settings of the plug-in and use a new custom analyzer tab to enter the details on how to call and analyze OCLint's output:
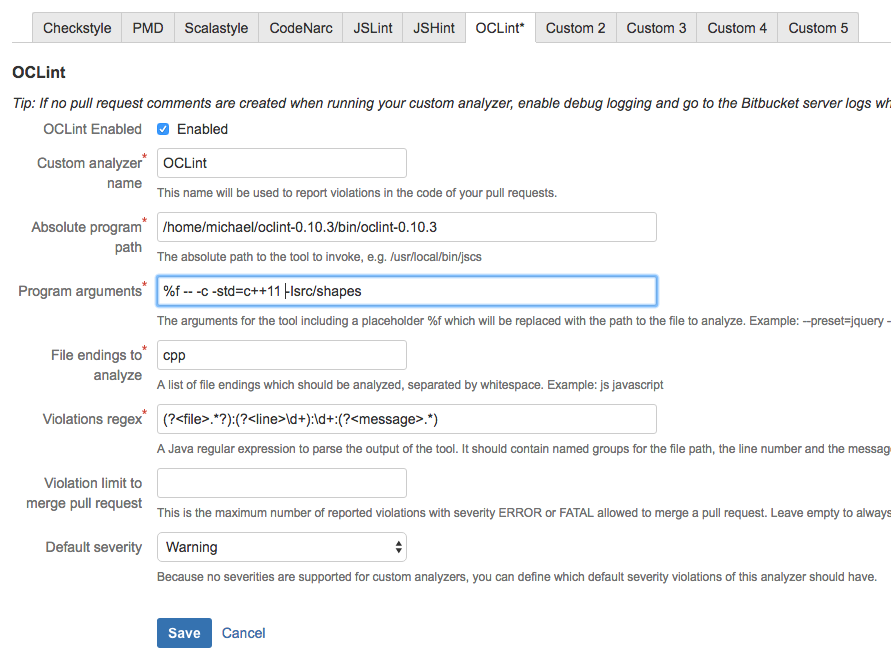
As you can see, in this example we pass the compiler flag "-std=c++11" because the C++ files make use of C++11 features and we also pass the path to a directory with #include files. We also have to define which files should be analyzed ("cpp" files) and the regular expression to analyze the output the program emits. Here's an example of OCLints output:
src/main.cpp:55:11: invalid operands to binary expression ('int *' and 'int')As you can see, you can use Java's regular expression syntax including named groups. The named groups should use "file", "line" and "message" so that the plug-in is able to create pull request comments for emitted code violations.
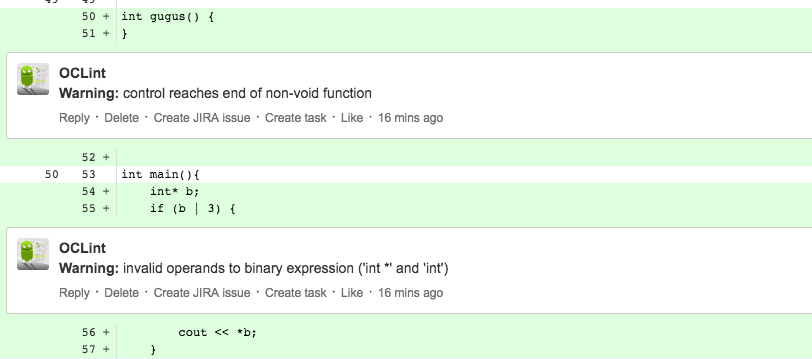
This is all that is necessary to configure the plug-in. When we open a pull request, the plug-in will call the custom static analyzer and create comments for all code violation messages matching the configured regular expression:
| Anchor | ||||
|---|---|---|---|---|
|
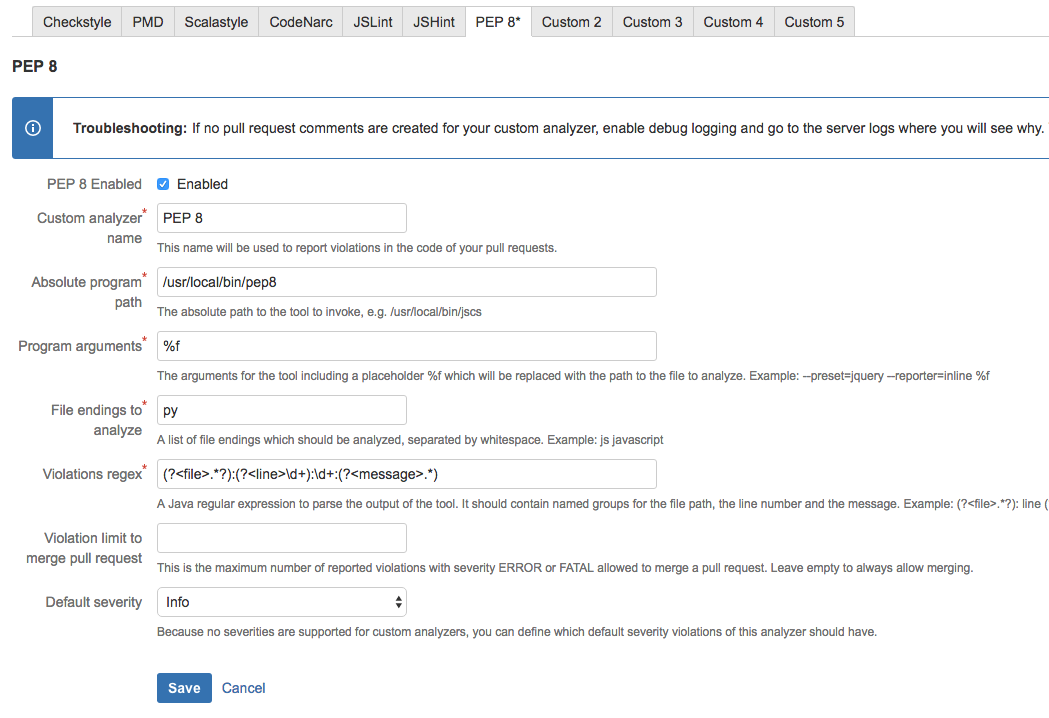
PEP8
To give you another example of how to use a custom static analyzer with the plug-in, we present the necessary configuration values for the famous Python Lint tool PEP8:
| Anchor | ||||
|---|---|---|---|---|
|
PHP CodeSniffer
PHP CodeSniffer detects violations of a defined set of coding standards in PHP files.
Program path:
/usr/bin/php
Program arguments:
/path/to/phpcs.phar --report=emacs %fs
Violations regex:
(?<file>.*?):(?<line>\d+):\d+:\s*(?<severity>\w+)\s*-\s*(?<message>.*)
| Anchor | ||||
|---|---|---|---|---|
|
ESlint
ESLint is a linter utility for JavaScript. The following example shows how to use a repository-relative eslint executable and configuration file:
Program path:
./node_modules/.bin/eslint
Program arguments:
-c .eslintrc.js --format=unix %f
Violations regex:
(?<file>.*?):(?<line>\d+):\d+:(?<message>.*) \[(?<severity>.*?)\/.*?\]
| Anchor | ||||
|---|---|---|---|---|
|
TSLint
TSLint is an static analysis tool that checks TypeScript code for readability, maintainability, and functionality errors.
Program arguments:
-t verbose %f
Violations regex:
(?<severity>.*?): (?<file>.*?)\[(?<line>\d+), \d+\]: (?<message>.*)
| Anchor | ||||
|---|---|---|---|---|
|
CSSLint
CSSLint allows automated linting of Cascading Stylesheets.
Program arguments:
--config=/home/atlbitbucket/.csslintrc --format=compact %fs
Violations regex:
(?<file>.*?): line (?<line>\d+), col \d+?, (?<message>.*)
| Anchor | ||||
|---|---|---|---|---|
|
HTMLLint
HTMLLint is the unofficial html5 linter and validator.
Program arguments:
--rc /home/atlbitbucket/.htmllintrc %fs
Violations regex:
(?<file>.*?): line (?<line>\d+), col \d+?, (?<message>.*)
| Anchor | ||||
|---|---|---|---|---|
|
JSCS
JSCS is a JavaScript code style linter and formatter for your style guide
Program arguments:
--preset=jquery --reporter=inline %fs


Violations regex:
(?<file>.*?): line (?<line>\d+), col \d+, (?<message>.*)
| Anchor | ||||
|---|---|---|---|---|
|
Pydocstyle
Pydocstyle is a static analysis tool for checking compliance with Python docstring conventions.
Program arguments:
%fs


Violations regex:
(?<file>.*?):(?<line>\d+).*?\r?\n(?<message>.*)
| Anchor | ||||
|---|---|---|---|---|
|
CPPLint
CPPLint is a static code checker for C++.
Program arguments:
--quiet %fs


Violations regex:
(?<file>.*?):(?<line>\d+):\s+(?<message>.*)
| Anchor | ||||
|---|---|---|---|---|
|
Clang-Tidy
Clang-Tidy is a clang-based linter utility for C++.
Program path:
/usr/local/bin/clang-tidy
Program arguments:
%fs -- -std=c++11
Violations regex:
(?<file>.*?):(?<line>\d+):\d+: (?<severity>.*?): (?<message>.*)
| Anchor | ||||
|---|---|---|---|---|
|
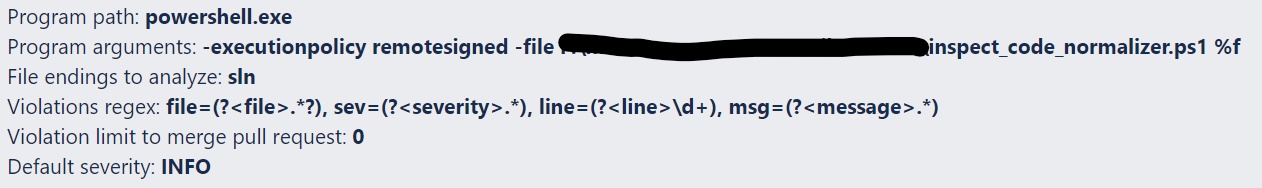
JetBrains InspectCode
ReSharpers code inspection is freely available as command line tool. The inclusion of InspectCode into CRA is different than for other static analyzers because it writes the results into a file and not to the command line. A script is needed to transform the output of the code inspection and write it to the command line. Such a script could look like:
| Code Block | ||||
|---|---|---|---|---|
| ||||
& inspectcode.exe $args[0] -output=<path_to_file>\pr.xml -a | Out-Null

[xml]$report = get-content <path_to_file>\pr.xml

$issueTypes = @{}
$report.Report.IssueTypes.IssueType | Foreach {
    $sev = $_.Severity
    if($sev -eq "HINT" -or $sev -eq "SUGGESTION") {
        $sev = "INFO" #CRA/Bitbucket does not support these
    }
    $issueTypes[$_.Id] = $sev}

#take all issues, exclude those without Line info
$report.selectNodes('//Issue[@Line[not(.="")]]') | Foreach {
    "file=$($_.File), sev=$($issueTypes[$_.TypeId]), line=$($_.Line), msg=$($_.Message)"
}

# file=(?<file>.*?), sev=(?<severity>.*), line=(?<line>\d+), msg=(?<message>.*) |
A possible configuration could look like:
To support concurrent analyzes, the script should be adapted:
- use a unique temporary filename
- remove the file after it is consumed by Powershell
If the severity is not of interest, you can specify a --format=text flag for inspectcode.exe. The script file can be simplified to (it is a .bat file):
| Code Block | ||||
|---|---|---|---|---|
| ||||
inspectcode.exe -format=text %1 -output=c<path_to_file>\pr.txt type <path_to_file>\pr.txt |
The according regex would look like:
\s*(?<file>.*?):(?<line>\d+) (?<message>.*)
| Table of Contents |
|---|